Wahl 2024 im Vereinigten Königreich: Ergebnisse nach Wahlkreisen
Psephos zeigt die Ergebnisse der Wahl 2024 im Vereinigten Königreich nach Wahlkreisen (650 Wahlkreise). Stärkste Kraft wurde Lab mit 33,7 % der Stimmen.
Interaktiv in der Karte öffnen
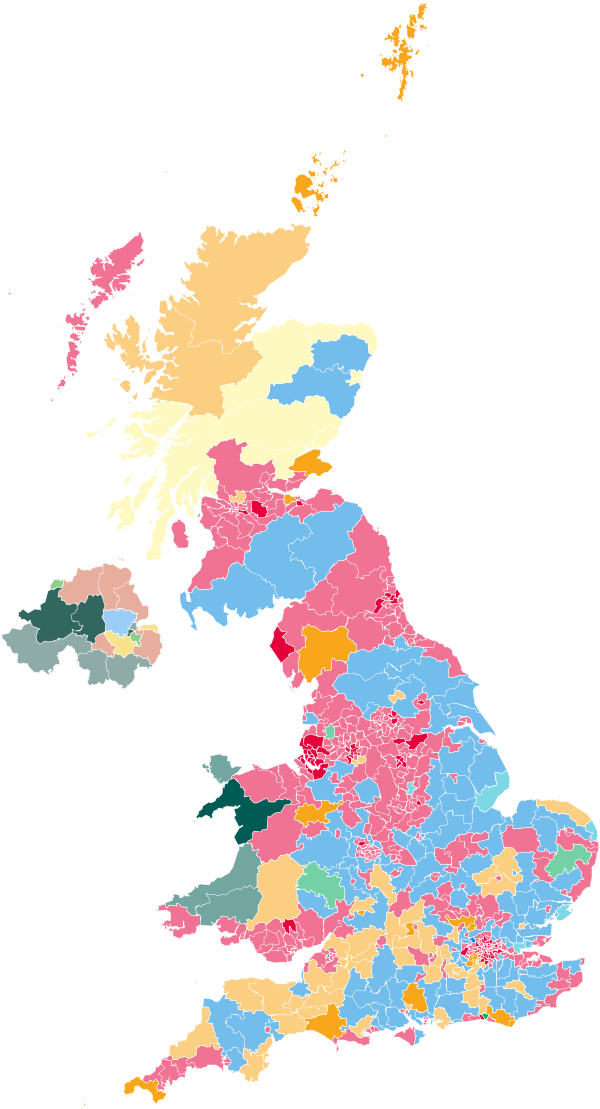
Gesamtergebnis (Stimmen)
| Partei | Stimmen | Anteil | Δ zu 2019 (Pp.) |
|---|---|---|---|
| Lab | 9.708.716 | 33,7 % | +1,2 |
| Con | 6.828.925 | 23,7 % | −20,5 |
| RUK | 4.117.610 | 14,3 % | neu |
| LD | 3.519.143 | 12,2 % | +0,5 |
| Green | 1.944.501 | 6,7 % | +4,0 |
| Sonstige | 1.089.096 | 3,8 % | neu |
| SNP | 724.758 | 2,5 % | −1,4 |
| SF | 210.891 | 0,7 % | +0,2 |
| PC | 194.811 | 0,7 % | +0,2 |
| DUP | 172.058 | 0,6 % | −0,2 |
| APNI | 117.191 | 0,4 % | ±0,0 |
| UUP | 94.779 | 0,3 % | ±0,0 |
| SDLP | 86.861 | 0,3 % | −0,1 |
Gültige Stimmen: 28.809.340 · Wahlberechtigte: 48.224.212 · Wählerinnen und Wähler: 0 · Beteiligung: 0,0 % · Vergleich mit der Wahl 2019
Stärkste Partei in den Wahlkreisen
- Lab: vorn in 416 von 650 (64 %)
- Con: vorn in 121 von 650 (19 %)
- LD: vorn in 72 von 650 (11 %)
- SNP: vorn in 9 von 650 (1 %)
- SF: vorn in 7 von 650 (1 %)
- DUP: vorn in 6 von 650 (1 %)
- RUK: vorn in 5 von 650 (1 %)
- Green: vorn in 5 von 650 (1 %)
- PC: vorn in 4 von 650 (1 %)
- SDLP: vorn in 2 von 650 (0 %)
- APNI: vorn in 2 von 650 (0 %)
- UUP: vorn in 1 von 650 (0 %)
Hochburgen und schwächste Ergebnisse
Nur Gebiete, in denen die Partei Stimmen erhielt.
Lab
Höchste Anteile
- Liverpool Walton – 70,6 %
- Bootle – 68,7 %
- Knowsley – 67,3 %
- Liverpool West Derby – 66,6 %
- Liverpool Riverside – 61,9 %
Niedrigste Anteile
- Westmorland and Lonsdale – 4,7 %
- Godalming and Ash – 5,0 %
- Esher and Walton – 5,3 %
- Winchester – 5,3 %
- Cheltenham – 5,4 %
Con
Höchste Anteile
- Harrow East – 53,3 %
- Richmond and Northallerton – 47,5 %
- Stone, Great Wyrley and Penkridge – 46,5 %
- Ruislip, Northwood and Pinner – 45,4 %
- Hertsmere – 44,7 %
Niedrigste Anteile
- South Down – 0,1 %
- Newry and Armagh – 0,2 %
- West Tyrone – 0,2 %
- Strangford – 0,4 %
- East Londonderry – 0,5 %
RUK
Höchste Anteile
- Clacton – 46,2 %
- Ashfield – 42,8 %
- Boston and Skegness – 38,4 %
- Great Yarmouth – 35,3 %
- Barnsley South – 33,2 %
Niedrigste Anteile
- Bristol Central – 3,1 %
- Hackney North and Stoke Newington – 3,1 %
- Islington North – 3,5 %
- East Ham – 3,5 %
- Edinburgh North and Leith – 3,7 %
LD
Höchste Anteile
- Westmorland and Lonsdale – 62,7 %
- St Albans – 56,6 %
- Twickenham – 56,3 %
- Orkney and Shetland – 55,1 %
- North East Fife – 54,7 %
Niedrigste Anteile
- Ynys Môn – 1,3 %
- Ashfield – 1,6 %
- Hartlepool – 1,6 %
- Coatbridge and Bellshill – 1,7 %
- Glasgow North East – 1,7 %
Quellen
Data: House of Commons Library · Open Parliament Licence v3.0 · Boundaries: Source: Office for National Statistics licensed under the Open Government Licence v.3.0 · Contains OS data © Crown copyright and database right 2024 · bearbeitet
- House of Commons Library: General election results (constituency data) – commonslibrary.parliament.uk · Lizenz OPL-UK-3.0
- Office for National Statistics: Westminster Parliamentary Constituencies, Boundaries (ONS Open Geography Portal): WPC Dec 2015, PCON Dec 2017, WPC Dec 2019, PCON July 2024 – geoportal.statistics.gov.uk · Lizenz OGL-UK-3.0
Status: amtlich endgültig. Berechnung und Darstellung: Psephos; Abweichungen in Summen durch Rundung möglich.