Wahl 2015 im Vereinigten Königreich: Ergebnisse nach Wahlkreisen
Psephos zeigt die Ergebnisse der Wahl 2015 im Vereinigten Königreich nach Wahlkreisen (650 Wahlkreise). Stärkste Kraft wurde Con mit 37,2 % der Stimmen.
Interaktiv in der Karte öffnen
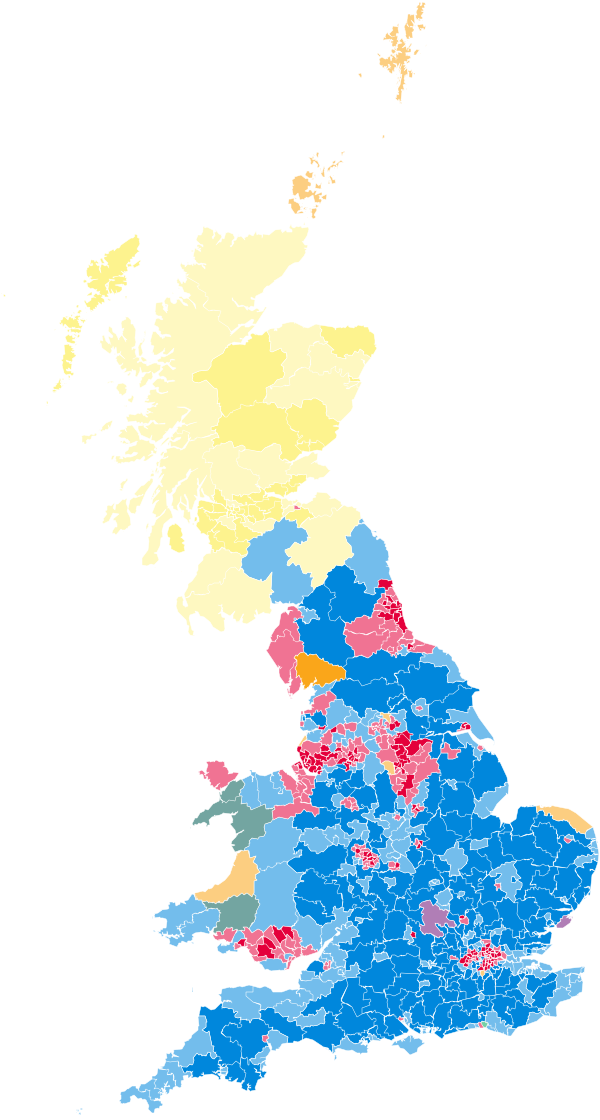
Gesamtergebnis (Stimmen)
| Partei | Stimmen | Anteil | Δ zu 2010 (Pp.) |
|---|---|---|---|
| Con | 11.299.609 | 37,2 % | −0,2 |
| Lab | 9.347.273 | 30,8 % | +0,7 |
| UKIP | 3.881.099 | 12,8 % | +9,6 |
| LD | 2.415.916 | 8,0 % | −15,9 |
| SNP | 1.454.436 | 4,8 % | +3,1 |
| Green | 1.157.630 | 3,8 % | +2,8 |
| DUP | 184.260 | 0,6 % | ±0,0 |
| PC | 181.704 | 0,6 % | ±0,0 |
| SF | 176.232 | 0,6 % | ±0,0 |
| UUP | 114.935 | 0,4 % | neu |
| SDLP | 99.809 | 0,3 % | −0,1 |
| APNI | 61.556 | 0,2 % | +0,1 |
Gültige Stimmen: 30.374.459 · Wahlberechtigte: 46.354.197 · Wählerinnen und Wähler: 0 · Beteiligung: 0,0 % · Vergleich mit der Wahl 2010
Stärkste Partei in den Wahlkreisen
- Con: vorn in 330 von 650 (51 %)
- Lab: vorn in 232 von 650 (36 %)
- SNP: vorn in 56 von 650 (9 %)
- DUP: vorn in 9 von 650 (1 %)
- LD: vorn in 8 von 650 (1 %)
- SF: vorn in 4 von 650 (1 %)
- PC: vorn in 3 von 650 (0 %)
- SDLP: vorn in 3 von 650 (0 %)
- UKIP: vorn in 2 von 650 (0 %)
- UUP: vorn in 2 von 650 (0 %)
- Green: vorn in 1 von 650 (0 %)
Hochburgen und schwächste Ergebnisse
Nur Gebiete, in denen die Partei Stimmen erhielt.
Con
Höchste Anteile
- North East Hampshire – 65,9 %
- Maidenhead – 65,8 %
- Windsor – 63,4 %
- Beaconsfield – 63,2 %
- Chelsea and Fulham – 62,9 %
Niedrigste Anteile
- Belfast West – 0,1 %
- Mid Ulster – 0,3 %
- Foyle – 0,4 %
- Newry and Armagh – 0,4 %
- Upper Bann – 0,4 %
Lab
Höchste Anteile
- Liverpool, Walton – 81,3 %
- Knowsley – 78,1 %
- East Ham – 77,6 %
- Liverpool, West Derby – 75,2 %
- Bootle – 74,5 %
Niedrigste Anteile
- West Aberdeenshire and Kincardine – 4,5 %
- Ross, Skye and Lochaber – 4,9 %
- Berwickshire, Roxburgh and Selkirk – 4,9 %
- North Cornwall – 5,4 %
- Westmorland and Lonsdale – 5,4 %
UKIP
Höchste Anteile
- Clacton – 44,4 %
- Boston and Skegness – 33,8 %
- South Thanet – 32,4 %
- Heywood and Middleton – 32,2 %
- Thurrock – 31,7 %
Niedrigste Anteile
- East Dunbartonshire – 1,0 %
- Edinburgh South – 1,2 %
- Glasgow North – 1,3 %
- Edinburgh North and Leith – 1,5 %
- East Renfrewshire – 1,6 %
LD
Höchste Anteile
- Westmorland and Lonsdale – 51,5 %
- Orkney and Shetland – 41,4 %
- Sheffield, Hallam – 40,0 %
- North Norfolk – 39,1 %
- Eastbourne – 38,2 %
Niedrigste Anteile
- Glasgow East – 0,7 %
- Glasgow North East – 0,8 %
- Glasgow South West – 1,0 %
- Coatbridge, Chryston and Bellshill – 1,1 %
- Motherwell and Wishaw – 1,2 %
Quellen
Data: House of Commons Library · Open Parliament Licence v3.0 · Boundaries: Source: Office for National Statistics licensed under the Open Government Licence v.3.0 · Contains OS data © Crown copyright and database right 2024 · bearbeitet
- House of Commons Library: General election results (constituency data) – commonslibrary.parliament.uk · Lizenz OPL-UK-3.0
- Office for National Statistics: Westminster Parliamentary Constituencies, Boundaries (ONS Open Geography Portal): WPC Dec 2015, PCON Dec 2017, WPC Dec 2019, PCON July 2024 – geoportal.statistics.gov.uk · Lizenz OGL-UK-3.0
Status: amtlich endgültig. Berechnung und Darstellung: Psephos; Abweichungen in Summen durch Rundung möglich.